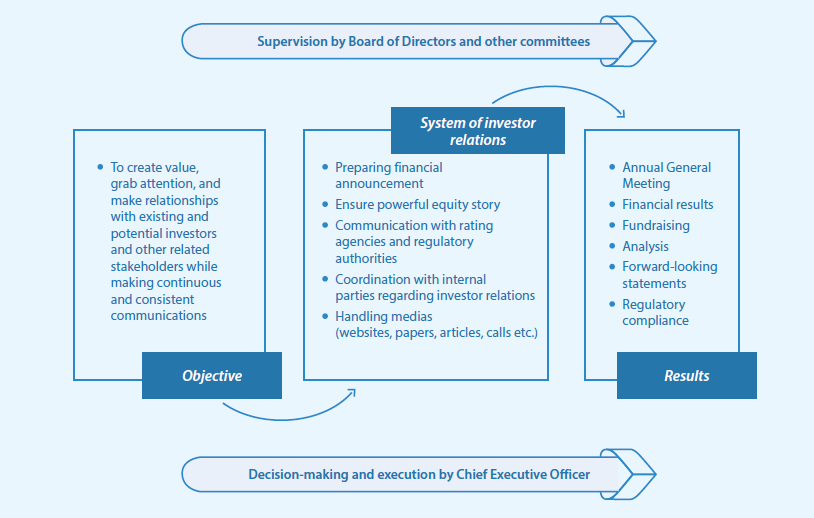
Investor relations consists of a dialogue between the Bank and
the financial markets, of information that helps the investment community, make judgements on the Bank’s market value vis-a-vis
the potential and sustainability of the Organisation. The feedback received from investors and the market also provides valuable insight to the Bank in strategic decision-making.
The Bank’s active investor engagement enables the market make sound decisions on their current and probable future shareholdings and investments in other securities.
At SDB Bank, the Annual General Meeting is the primary platform for communicating the Bank’s performance while the Annual Report gives detailed, yet succinct information on its activities, use of its different forms of capital and its responsible social capital involvement. In addition, the Bank has one-on-one interactions with significant investors and other publications through the Colombo Stock Exchange.
Through these avenues of contact, the Bank helps investors gain a balanced view of its operating results, financial position (Balance sheet) and its liquidity, through the Cash Flow Statement. Furthermore, these disclosures help investors get a reasonable understanding of the Bank’s strategic direction, governance, risk management, and the future business prospects.
It is expected that through sharing these many facets of information, current and potential investors will appreciate the value of the Bank and build and strengthen their relationship with the Bank.
Accountability, transparency, and good governance are at the forefront of the Bank’s operations and the emphasis placed on these aspects in our communications with our investors give them the confidence that the operations are being conducted in line with best practices from around the world.
Our investor relations programme is designed to achieve the following:
A competitive price for the Bank’s shares;
A healthy level of transactions of the Bank’s shares on the stock exchange;
Easier and cheaper access to capital in the future; and
Reduced volatility in the share price through maintaining a loyal group of investors.
At SDB Bank, we believe that successful investor relations are achieved through regular exchange of information with the market and is therefore integral to our communication strategy.
Types
Quoted ordinary shares
Debentures
Listing details
Ordinary shares
Listed exchange : Colombo Stock Exchange (CSE) Main Board
Sector : Banks Finance and Insurance
Quoted date : 31 May 2012
Code-ISIN : LK0412N00003
Stock symbol : SDB.N000
Debentures
Type
Code
ISIN
Par value
LKR
Coupon rate
(Per annum)
%
Credit
rating
A
SDB-BD-
31/12/18-C2338-9.6
LK0412D23386
100
9.60
A+(SO)
B
SDB-BD-
31/12/20-C2337-10
LK0412D23394
100
10.00
A+(SO)
C
SDB-BD-
31/12/18-C2340-9.9
LK0412D23402
100
9.90
A-(SO)
D
SDB-BD-
31/12/20-C2339-10.30
LK0412D23378
100
10.30
A-(SO)
Credit ratings
The Bank has obtained credit ratings from Fitch Ratings Lanka Ltd., and ICRA Lanka Limited. The ratings take into consideration the Bank’s performance, asset quality, capitalisation, liquidity and market position among others.
Performance of securities – Bank market capitalisation
and share trading details
Bank market capitalisation
2018
2017
2016
2015
2014
SDB Bank market
capitalisation
(LKR Bn.)
4.22
5.58
4.36
6.32
3.43
Increase/decrease in
market capitalisation
of SDB Bank (%)
-24
28
-31
84
77
CSE market
capitalisation
(LKR Bn.)
2,839.44
2,899.29
2,745.00
2,938.00
3,104.90
SDB Bank market
capitalisation
as a % of CSE market
capitalisation (%)
0.15
0.19
0.16
0.22
0.11
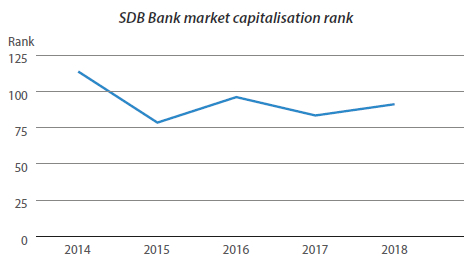
Market capitalisation
rank of SDB Bank
91
83
96
78
114
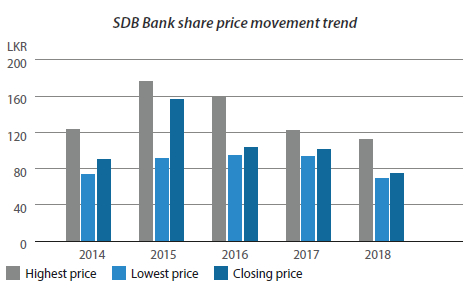
Bank share price movement
Bank share price movement
2018
2017
2016
2015
2014
Highest price (LKR)
112.90
122.50
158.80
176.00
124.00
Lowest price (LKR)
70.00
93.80
95.20
91.00
73.50
Price as at 31 December
(LKR)
75.00
101.90
103.70
157.10
90.90
Value creation – CSE market price vs Banking industry
CSE market
2018
2017
2016
2015
2014
Market price-earnings
ratio (PER) (Times)
9.65
10.60
12.4
17.98
19.66
Market Price to Book
Value (PBV) (Times)
1.18
1.31
1.4
1.99
2.20
Market Dividend Yield
(DY) (%)
3.09
3.19
2.8
2.18
2.09
Banking industry
2018
2017
2016
2015
2014
Market Price-Earnings
Ratio (PER) (Times)
5.4
6.6
7.0
11.00
13.50
Market Price to Book
value (PBV) (Times)
0.9
1.1
1.2
1.40
1.80
Market Dividend Yield
(DY) (%)
2.8
2.5
3.3
3.00
2.60
A dividend is a distribution of reward, from a portion of the Bank’s earnings, and is paid to the ordinary shareholders annually.
The amount declared and paid each year varies in relation to
the earnings of the Bank. It strikes a balance between a fair return to the shareholders for their investment and the business requirements
to maintain the sustainability of the Bank.
Dividends are decided and managed by the Bank’s Board of Directors and they are approved by the shareholders through the exercise of their voting rights.
Year
Profit for
the year
(LKR Mn.)
Total
dividend paid
(LKR Mn.)
Dividend
per share
(LKR)
Dividend
payout ratio
(%)
Dividend
yield
(%)
2014
504.45
94.58
10.00
74.86
11.00
2015
720.57
109.16
10.00
55.85
6.37
2016
403.72
131.24
7.50
78.13
7.23
2017
507.82
136.94
6.00
58.94
5.89
2018
356.95
–
–
–
–
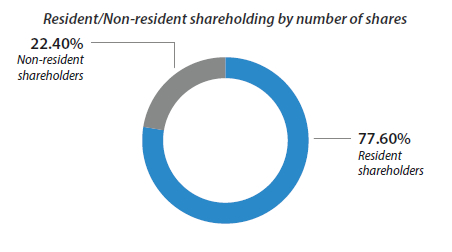
Analysis of shareholders
Resident/Non-Resident
31 December 2018
31 December 2017
No. of
shareholders
%
No. of
shares
%
No. of
shareholders
%
No. of
shares
%
Resident shareholders
37,632
99.958
43,693,059
77.596
38,269
99.963
42,545,930
77.67
Non-resident shareholders
16
0.042
12,615,193
22.404
14
0.037
12,232,937
22.33
Total
37,648
100
56,308,252
100
38,283
100
54,778,867
100
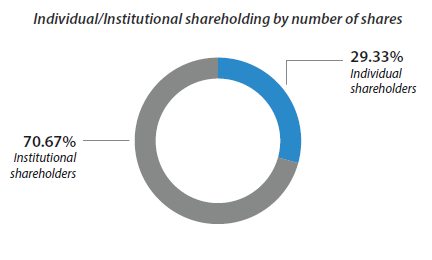
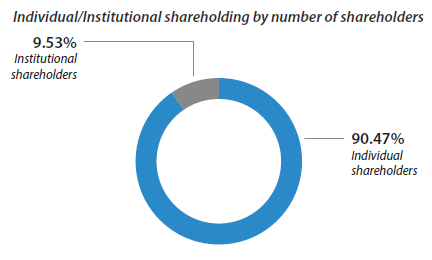
Individual/Institutional
31 December 2018
31 December 2017
No. of shareholders
%
No. of shares
%
No. of
shareholders
%
No. of
shares
%
Individual shareholders
34,060
90.47
16,516,455
29.33
34,710
90.67
16,242,578
29.65
Institutional shareholders
3,588
9.53
39,791,797
70.67
3,573
9.33
38,536,289
70.35
Total
37,648
100
56,308,252
100
38,283
100
54,778,867
100
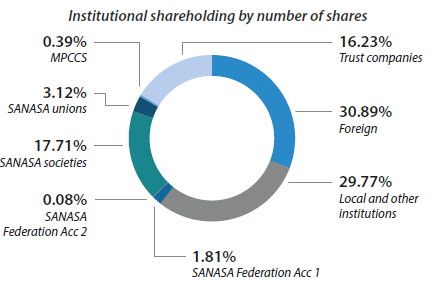
Institutional sub analysis
31 December 2018
31 December 2017
No. of shareholders
%
No. of shares
%
No. of
shareholders
%
No. of
shares
%
Foreign
4
0.010
12,289,797
21.83
3
0.01
11,942,201
21.80
Local and other institutions
50
0.133
11,847,519
21.04
47
0.12
10,927,204
19.95
Sanasa federation
Acc 1
1
0.002
720,024
1.27
1
0.01
764,730
1.40
Acc 2
28,439
0.05
27,658
0.05
Sanasa societies
3372
8.957
7,047,079
12.52
3,360
8.77
6,365,985
11.62
Sanasa unions
35
0.093
1,242,645
2.21
34
0.09
1,147,359
2.09
MPCCS
21
0.056
156,595
0.28
21
0.05
152,301
0.28
Trust companies
105
0.279
6,459,699
11.47
107
0.28
7,208,851
13.16
Total
3,588
9.53
39,791,797
70.67
3,573
9.33
38,536,289
70.35
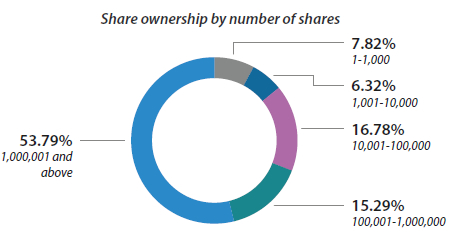
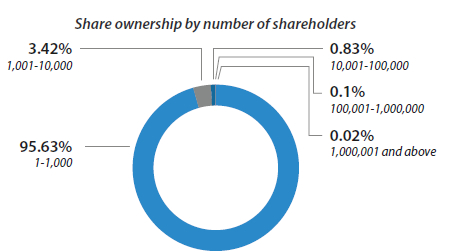
Share ownership composition
31 December 2018
31 December 2017
No. of shareholders
%
No. of shares
%
No. of
shareholders
%
No. of
shares
%
1-1000
36,003
95.63
4,404,185
7.82
36,659
95.76
4,472,661
8.17
1001-10000
1,286
3.42
3,556,285
6.32
1,282
3.35
3,530,007
6.44
10001-100000
313
0.83
9,447,858
16.78
294
0.77
9,237,897
16.86
100001-1000000
38
0.10
8,607,818
15.29
40
0.10
9,277,569
16.94
1000001 and above
8
0.02
30,292,106
53.79
8
0.02
28,260,733
51.59
37,648
100
56,308,252
100
38,283
100
54,778,867
100
Composition of shareholders – Top twenty shareholders
No.
Shareholder name
31 December 2018
31 December 2017
No. of shares
%
No. of shares
%
1.
Seylan Bank PLC/DR Thirugnanasambandar Senthilverl
6,936,510
12.32
6,203,204
11.32
2.
Ayenka Holdings (Pvt) Ltd.
6,779,840
12.04
–
–
3.
SBI FMO Emerging Asia Financial Sector Fund PTE. LTD.
5,045,636
8.96
4,906,926
8.96
4.
CB NY S/A International Finance Corporation
4,991,644
8.86
4,854,419
8.86
5.
Nederlandse Financierings Maatschappij Voor Ontwikkelingslanden N.V
2,242,504
3.98
2,180,856
3.98
6.
People’s Leasing & Finance PLC
2,094,012
3.72
2,036,446
3.72
7.
Seemasahitha SANASA Rakshana Samagama (General)
1,162,630
2.06
1,130,669
2.06
8.
Kegalle SANASA Shareholders Trust Company Limited
1,039,330
1.85
1,010,758
1.85
9.
Seemasahitha SANASA Rakshana Samagama (Life)
910,708
1.62
885,672
1.62
10.
Sampath Bank PLC/Dr T Senthilverl
871,885
1.55
835,005
1.52
11.
Sanasa Federation Ltd.
720,024
1.28
764,730
1.40
12.
Polgahawela Sanasa Societies Union Ltd
387,314
0.69
351,804
0.64
13.
Hambantota DTCCS Union Ltd.
384,257
0.68
373,694
0.68
14.
Warakapola SANASA Shareholders Trust Company Ltd.
380,249
0.67
511,257
0.93
15.
Dr T Senthilverl
373,598
0.66
34,837
0.06
16.
Kolonnawa SANASA Shareholders Trust Company Ltd.
257,370
0.46
250,295
0.46
17.
Mr D P Pieris
257,067
0.46
343,107
0.63
18.
Polgahawela SANASA Shareholders Trust Company Ltd.
238,667
0.42
234,256
0.43
19.
Sampath Bank PLC/Mr Arunasalam Sithampalam
224,333
0.40
26,093
0.05
20.
Dr S Yaddehige
205,653
0.37
265,466
0.48
Total
35,503,231
63.05
27,199,494
49.65
31 December 2018
31 December 2017
No. of shares
%
No. of shares
%
Total number of shares registered
48,686,639
86.46
46,999,562
85.80
Total number of shares unregistered
7,621,613
13.54
7,779,305
14.20
Total Number of shares issued
56,308,252
100
54,778,867
100
Shares held by Directors
75,243
0.13
73,062
0.13
Shares held by institutions
39,791,797
70.67
38,536,289
70.35
Balance held by public
16,441,212
29.20
16,169,516
29.52
Total Number of shares issued
56,308,252
100
54,778,867
100
Shares held by public
56,231,740
99.86
54,704,570
99.86
Shares held by Directors and related parties
76,512
0.14
74,297
0.14
Total
56,308,252
100
54,778,867
100
Directors’ and CEO’s shareholding
Name
31 December 2018
31 December 2017
No. of Shares
%
No. of Shares
%
Ms S Kiriwandeniya (Chairperson)
5,785
0.0102
5,627
0.010
Mr P Subasinghe (Director)
69,341
0.1231
67,435
0.123
Mr K G Wijerathne (Director)
117
0.0002
–
–
Total
75,243
0.1335
73,062
0.133
Record of scrip issue
Year
New proportion
Old proportion
No. of shares listed
Date listed
2017
1
22.8533
2,279,147
12 June 2017
2018
–
–
–
–
Record of right issue (2014)
Code
Close price
LKR
Highest price
LKR
Lowest price
LKR
Turnover
LKR
No. of
shares
Trades
SDB.R0000
15.00
24.00
10.70
31,153,089.00
2,191,458
1,717
Date of allotment
No. of shares
provisionally allotted
Consideration
per share
LKR
Final allotment
no. of shares
Amount raised
LKR
Proportion
Date issued
18 November 2014
12,587,661
80.00
12,587,661
1,007,012,880.00
1:2
30 December 2014
Utilisation of funds raised through right issue
Objective
No.
Objective as per circular
Amount allocated
as per circular in
LKR
Proposed date of
utilisation
as per circular
Amount allocated
from proceeds in
LKR
% of
total
proceeds
Amounts
utilised in
LKR
% of utilisation
against
allocation
1
To increase the Bank’s capital
base and to finance portfolio
growth whilst strengthening
the balance sheet.
1,007,012,880
Nine months
from the date of
allotment
1,007,012,880
100
1,007,012,880
100
Market capitalisation
CSE Market and Banking Industry
2018
2017
2016
2015
2014
CSE market capitalisation (LKR Bn.)
2,839.44
2,899.29
2,745.00
2,938.00
3,104.90
S & P SL20 (31/12)
3,135.18
3,671.72
3,496.44
3,625.69
4,089.14
All share price index (31/12)
6,052.37
6,369.26
6,228.26
6,894.50
7,298.95
Banking, and finance and insurance sector
market capitalisation (LKR Bn.)
784.24
769.97
653.86
699.84
753.69
Market share trading
Market share trading
2018
2017
2016
2015
2014
Number of transactions
885,657
981,977
1,056,849
1,506,790
1,982,709
Number of shares traded
6001
8,468
7,196
9,415
16,722
Value of shares traded (LKR Mn.)
200,068.84
220,591.24
176,935.45
253,251.01
340,917.12
Average Daily Turnover (LKR Mn.)
833.62
915.43
737.23
1,059.63
1,414.59
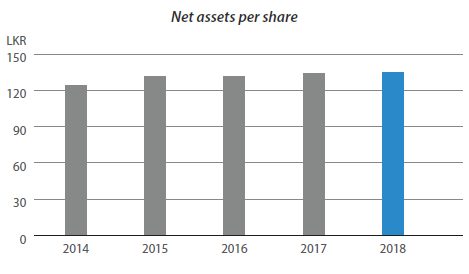
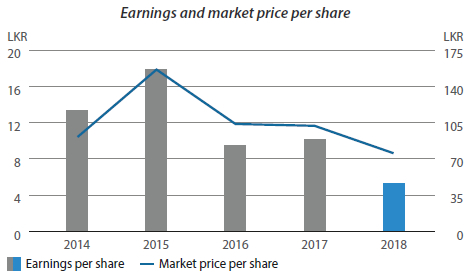
SDB Bank value creation for ordinary shareholders
SDB Bank
2018
2017
2016
2015
2014
Net asset value per share (LKR)
132.28
133.83
131.22
131.62
124.35
Basic earnings per share (LKR)
6.34
9.87
9.60
17.90
13.36
Dividend per share (LKR)
Nil
6.00
7.50
10.00
10.00
Market price per share as at 31 December (LKR)
75.00
101.90
103.70
157.10
90.90
Price-Earnings Ratio (PER) (Times)
11.83
10.32
10.80
8.78
6.80
Price to Book Value (PBV) (Times)
0.57
0.76
0.79
1.19
0.73
Dividend Yield (DY) (%)
–
5.89
7.23
6.37
11.00
Dividend payout (%)
–
58.94
78.13
55.85
74.86
Number of shares (No. Mn.)
56.31
54.78
42.06
40.25
37.76
Number of shareholder
37,648
38,283
39,374
40,283
45,446
Total equity (LKR Mn.)
7,448.73
7,331.16
5,519.28
5,297.35
4,695.97
Stated capital (LKR Mn.)
5,921.54
5,758.69
4,062.96
3,794.09
3,533.55
Debt to equity (Times)
11.83
10.09
10.75
10.12
7.42
Interest cover (Times)
1.08
1.11
1.13
1.34
1.31
Return on equity (%)
4.83
7.90
7.46
14.42
12.49
Earnings growth (%)
(14.41)
22
(43.97)
42.84
103.26
Quick assets ratio (%)
0.65
0.63
0.65
0.55
0.67
Basic information of the debentures
Type A
Type B
Type C
Type D
Tenure
3 years
5 years
3 years
5 years
Issue date
31.12. 2015
31.12. 2015
31.12. 2015
31.12. 2015
Maturity date
31.12. 2018
31.12. 2020
31.12. 2018
31.12. 2020
Frequency of interest payable
Semi-annual
Semi-annual
Semi-annual
Semi-annual
Market value
Not traded
Not traded
Not traded
Not traded
Other information of the debentures
2018
2017
Balance as at 31 December LKR ’000
Coupon rate
%
Annual effective rate
%
Interest rate comparable Government Securities
%
Balance as at
31 December
LKR ’000
Coupon
rate
%
Annual
effective rate
%
Interest rate comparable
Government Securities
%
Type A
1,674.695
9.60
9.83
11.42
1,672,156
9.60
9.83
9.93
Type B
422,906
10.00
10.25
11.58
422,266
10.00
10.25
10.25
Type C
1,509,819
9.90
10.15
11.42
1,505,823
9.90
10.15
9.93
Type D
591,128
10.30
10.57
11.58
589,567
10.30
10.57
10.25
Utilisation of funds raised through debenture issue
Objective Number
Objective as per prospectus
Amount allocated
as per prospectus in
LKR
Proposed date
of utilisation as per
Prospectus
Amount allocated
from proceeds in
LKR
% of total
proceeds
Amounts
utilised in
LKR
% of utilisation
against
allocation
1
To raise medium term funds to manage assets and liability mismatch and to minimise the interest rate risk
–
–
–
–
–
100
2
To finance the budgeted lending portfolio (approximately 90% as loans and the balance as leasing) and to minimise the mismatch in funding exposure
4,000,000,000
In the ordinary
course business
within the next
12 months from
the date of allotment
3,600,000,000
for loans and
400,000,000 for
leasing